
India’s total exports for FY 2025-26 reached a record $860.09 billion, marking a 4.22% rise over the previous year, even as merchandise shipments faced headwinds in the final month of the fiscal year. The Ministry of Commerce and Industry released the official trade data on 15 April 2026, confirming a resilient full-year performance anchored by a booming services sector and steady non-petroleum merchandise exports.
For exporters, importers, and trade finance professionals tracking India’s global trade trajectory, the FY 2025-26 numbers paint a nuanced picture: strong structural growth in services and non-oil merchandise, a widened merchandise trade deficit, and notable shifts in key trading corridors.
India’s Total Exports Cross $860 Billion in FY 2025-26
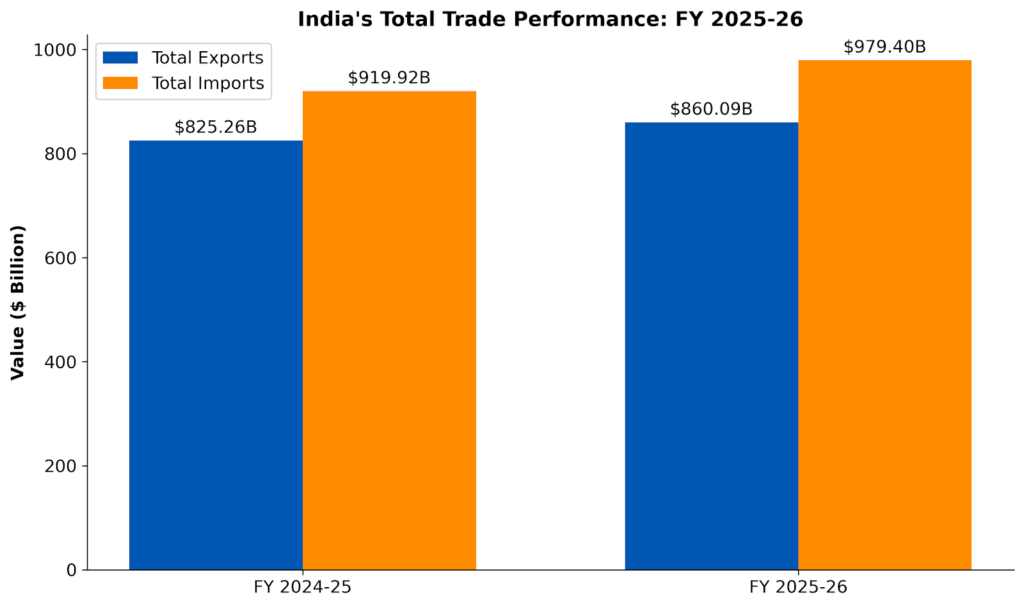
India’s combined merchandise and services exports for the full financial year (April 2025 to March 2026) reached $860.09 billion, up from $825.26 billion in FY 2024-25. Total imports for the same period reached $979.40 billion, registering a 6.47% increase. Consequently, the full-year trade balance widened to -$119.30 billion. In contrast, the previous year recorded a balance of -$94.66 billion.
Full-Year Trade at a Glance (FY 2025-26 vs FY 2024-25)
| Category | FY 2025-26 ($ Bn) | FY 2024-25 ($ Bn) | Growth |
|---|---|---|---|
| Merchandise Exports | 441.78 | 437.70 | +0.93% |
| Merchandise Imports | 774.98 | 721.20 | +7.46% |
| Services Exports | 418.31 | 387.55 | +7.94% |
| Services Imports | 204.42 | 198.72 | +2.87% |
| Total Exports | 860.09 | 825.26 | +4.22% |
| Total Imports | 979.40 | 919.92 | +6.47% |
| Trade Balance | -119.30 | -94.66 | — |
March 2026: Monthly Trade at a Glance
Additionally, India’s total exports, which encompass both merchandise and services, fell by 4.58% to $74.11 billion in March 2026. Consequently, this figure represents a decline relative to the $77.67 billion recorded in March 2025.Total imports for March 2026 came in at $76.55 billion, down 5.76% year-on-year. The monthly trade balance narrowed to -$2.44 billion in March 2026 from -$3.55 billion in March 2025.
March 2026 Monthly Trade Summary
| Category | March 2026 ($ Bn) | March 2025 ($ Bn) |
|---|---|---|
| Merchandise Exports | 38.92 | 42.05 |
| Merchandise Imports | 59.59 | 63.74 |
| Services Exports* | 35.20 | 35.63 |
| Services Imports* | 16.96 | 17.48 |
| Total Exports | 74.11 | 77.67 |
| Total Imports | 76.55 | 81.22 |
| Trade Balance | -2.44 | -3.55 |
March 2026 services data is estimated. The latest RBI-released services data is for February 2026.
Merchandise Trade: Non-Petroleum Exports Grow 3.62% for Full Year
Merchandise exports for FY 2025-26 totalled $441.78 billion, a 0.93% increase over the $437.70 billion recorded in FY 2024-25. Non-petroleum merchandise exports rose 3.62% to $387.88 billion, up from $374.32 billion in FY 2024-25.
Furthermore, the merchandise trade deficit for FY 2025-26 widened to $333.19 billion. In contrast, the previous financial year registered a deficit of $283.50 billion.
Specifically, non-petroleum and non-gems and jewellery exports reached $359.67 billion in FY 2025-26. Furthermore, this figure surpassed the $344.50 billion that the previous financial year recorded. Additionally, non-petroleum and non-gems and jewellery imports amounted to $498.56 billion during the same period. Consequently, this value exceeded the $454.59 billion registered in FY 2024-25.
Trade Excluding Petroleum and Gems and Jewellery (FY 2025-26 vs FY 2024-25)
| Category | FY 2025-26 ($ Bn) | FY 2024-25 ($ Bn) |
|---|---|---|
| Non-petroleum Exports | 387.88 | 374.32 |
| Non-petroleum Imports | 601.03 | 535.42 |
| Non-petroleum and Non-Gems and Jewellery Exports | 359.67 | 344.50 |
| Non-petroleum and Non-Gems and Jewellery Imports | 498.56 | 454.59 |
Sector-Wise Export Performance in March 2026
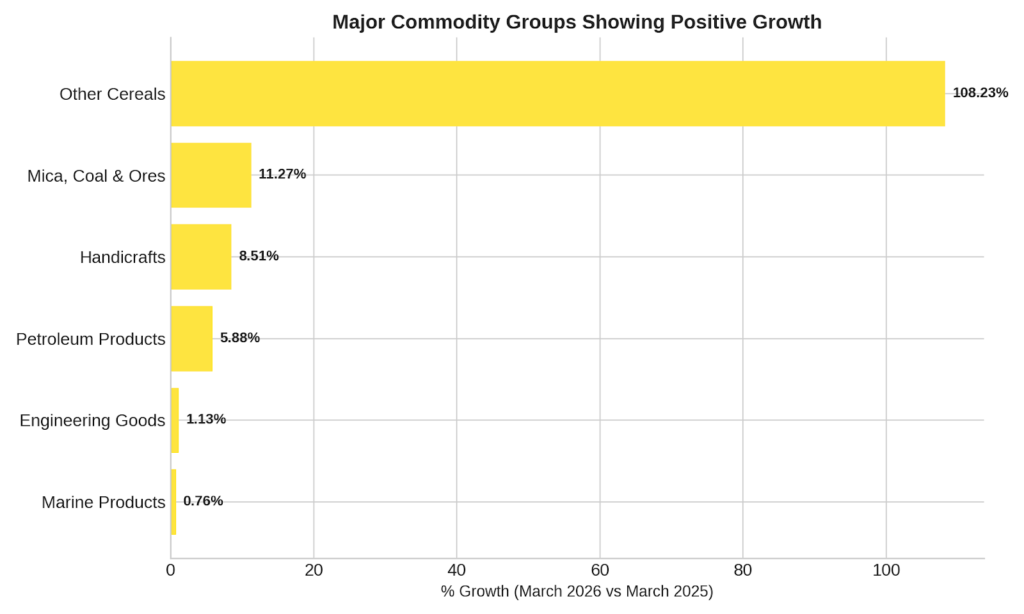
Specifically, several merchandise categories achieved positive growth in March 2026. Furthermore, these sectors showed resilience when compared to the corresponding performance from the previous year.
- Other Cereals — up 108.23% (from $0.03 Bn to $0.06 Bn)
- Mica, Coal and Other Ores, Minerals (incl. processed) — up 11.27% (from $0.52 Bn to $0.58 Bn)
- Handicrafts (excl. handmade carpets) — up 8.51% (from $0.13 Bn to $0.14 Bn)
- Petroleum Products — up 5.88% (from $4.90 Bn to $5.18 Bn)
- Engineering Goods — up 1.13% (from $10.82 Bn to $10.94 Bn)
- Marine Products — up 0.76%
Import Categories Registering Contraction in March 2026
Several import segments recorded year-on-year decline in March 2026:
- Petroleum, Crude and Products: -35.91%
- Gold: -31.63%
- Cotton Raw and Waste: -30.38%
- Project Goods: -23.7%
- Pulses: -21.81%
- Pulp and Waste Paper: -19.11%
- Chemical Material and Products: -18.43%
- Iron and Steel: -14.21%
- Transport Equipment: -13.7%
- Pearls, Precious and Semi-Precious Stones: -13.15%
- Wood and Wood Products: -8.02%
- Organic and Inorganic Chemicals: -6.4%
- Artificial Resins, Plastic Materials, Etc.: -2.98%
- Newsprint: -2.22%
Services Trade: Exports Grow 7.94% for Full Year
Specifically, services exports for FY 2025-26 grew by 7.94% to reach $418.31 billion. This performance marks a significant increase from the $387.55 billion recorded in FY 2024-25. Furthermore, the services trade surplus for FY 2025-26 achieved a total of $213.89 billion. In comparison, the surplus for the previous financial year stood at $188.84 billion.
Specifically, services exports for March 2026 reached an estimated $35.20 billion. In comparison, this figure fell slightly below the $35.63 billion recorded in March 2025. Furthermore, services imports for March 2026 amounted to an estimated $16.96 billion. Consequently, this value reflects a decrease from the $17.48 billion registered in March 2025. Regarding the full-year trajectory, total services imports for FY 2025-26 reached $204.42 billion. In contrast, this category stood at $198.72 billion during FY 2024-25.
Top Export Destinations by Growth
March 2026 (vs March 2025)
- Singapore: +158.55%
- Tanzania: +100.54%
- Sri Lanka: +88.31%
- Malaysia: +84.47%
- China: +28.10%
FY 2025-26 Full Year (vs FY 2024-25)
- Spain: +46.33%
- China: +36.66%
- Hong Kong: +33.22%
- Vietnam: +22.78%
- Sri Lanka: +21.14%
Top Import Sources by Growth
March 2026 (vs March 2025)
- Peru: +267.67%
- Oman: +112.01%
- Thailand: +64.53%
- China: +24.81%
- USA: +14.40%
FY 2025-26 Full Year (vs FY 2024-25)
- Peru: +78.08%
- UK: +36.09%
- Hong Kong: +23.32%
- China: +16.03%
- USA: +15.95%
As trade corridors multiply and financing needs grow more complex, businesses that move quickly to secure the right banking relationships, across borders and currencies, will be best placed to capture the next wave of growth. That is precisely the kind of connectivity 360tf was built to enable.
Disclaimer: The above information is provided for informational purposes only and does not constitute financial, legal, or professional advice. 360tf assumes no liability for any reliance placed on third-party content and disclaims all responsibility for any loss or damage arising therefrom.